
For adults 40 to 59, the most widely used reference ranges put a healthy body fat percentage at about 23 to 34 percent for women and 11 to 22 percent for men. At 60 to 79, the bands move up to about 24 to 36 and 13 to 25 percent. They come from a 2000 study of 1,626 adults that mapped measured body fat onto standard BMI cut-offs, so they're reference ranges, not diagnoses. The typical adult aged 40 to 59 in national DXA data from 1999 to 2004 measured above that band, so your own trend matters more than any single cut-off.
- At ages 40 to 59, reference ranges put healthy body fat at about 23 to 34% for women and 11 to 22% for men.
- The "normal" bar on an InBody result sheet (18 to 28% for women, 10 to 20% for men) is not age-adjusted.
- Skeletal muscle mass is the second number to watch; InBody's normal range for it is 90 to 110% of standard.
- On InBody devices, a change smaller than about 2 to 3 percentage points can be measurement noise.
- Scan monthly on the same device, at the same time of day, with steady hydration.
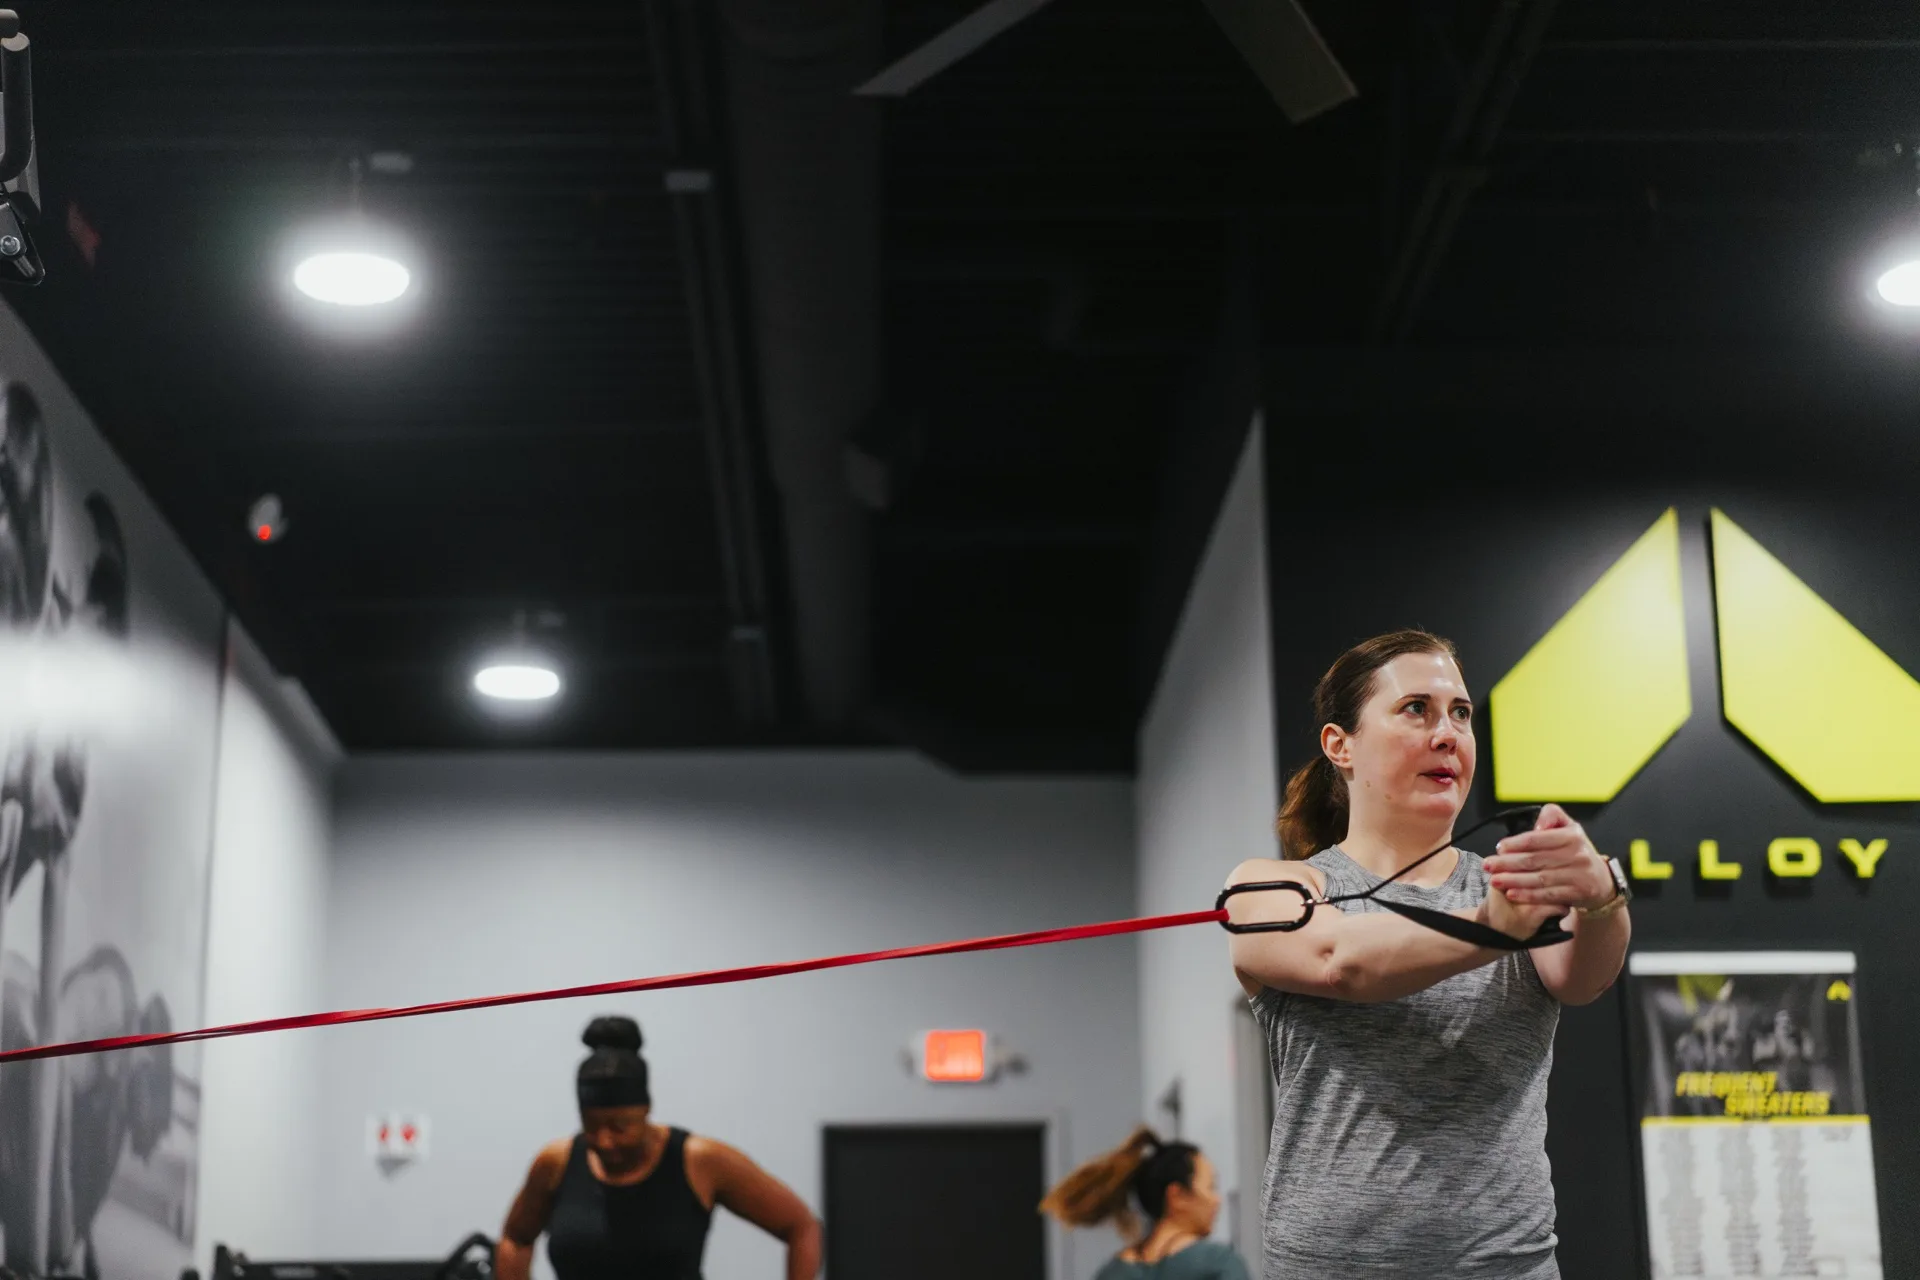
Healthy body fat percentage chart by age
Each healthy range below runs from the body fat predicted at a BMI of 18.5 to the level predicted at 25, using the study's table for African American and white adults. The last column is the "normal" band printed on an InBody result sheet.
| Age | Women: healthy range | Men: healthy range | InBody "normal" band (all ages) |
|---|---|---|---|
| 20 to 39 | 21 to 33% | 8 to 20% | Women 18 to 28%, men 10 to 20% |
| 40 to 59 | 23 to 34% | 11 to 22% | Women 18 to 28%, men 10 to 20% |
| 60 to 79 | 24 to 36% | 13 to 25% | Women 18 to 28%, men 10 to 20% |
The InBody column is the manufacturer's standard range from the InBody 770 training manual, centered on 23 percent for women and 15 percent for men. It isn't age-adjusted, which is why a woman in her 50s can sit inside the healthy research band while her bar on the sheet runs past "normal."
The 2000 study's authors called their ranges "provisional" and wrote that the study's focus "was not to establish definitive body fat ranges." If you've seen 23 to 33 and 11 to 21 percent for this age group, that widely copied chart rounds the upper bounds down by a point. The published table says 34 and 22.
American Community Survey estimates for 2020 to 2024 put Pinecrest's median age at 42.3, and roughly three in four adults in the village are 40 or older. For most adults here, the middle row is the one that applies.
Body fat percentage by age: what the research shows
In reference data, body fat percentage runs higher in each older age group, at least into the 50s. A DXA reference study of 3,327 adults found body fat was "higher per decade with increasing age up to the 50-59 year age group in both sexes." The median man measured 20.0 percent in his 40s and 22.5 percent in his 50s, while the median woman went from 35.9 to 39.0 percent.
That sample was mostly white volunteers tested at two university labs, so it's one reference point, not a national average.
Muscle is the other half of the picture. An MRI study of 468 adults aged 18 to 88 found that a noticeable drop in skeletal muscle mass didn't appear until the end of the 40s, and the decline was mostly in lower-body muscle.
Because body fat percentage is a share of total weight, it can move when either fat or muscle changes. That's why we read it next to muscle, not on its own.
Healthy range vs. average: where adults 40 to 59 actually sit
For adults 40 to 59, the national median sits several points above the top of the healthy range. Here's how percent body fat was spread across that age group in the same 1999 to 2004 DXA survey:
- Women (2,049 measured): 10th percentile 31.8%, 25th 36.4%, median 41.0%, 75th 45.1%, 90th 48.6%
- Men (2,024 measured): 10th percentile 21.5%, 25th 25.2%, median 28.5%, 75th 32.2%, 90th 35.5%
Even the 25th percentile sits above the healthy band's upper bound: 36.4 against 34 for women, and 25.2 against 22 for men. "Healthy" describes a range built from BMI cut-offs, while "average" describes the people who were actually scanned. Neither one is a verdict on you.
Who was measured matters too. The 2000 study measured African American, Asian and white adults, and it printed separate, slightly higher ranges for the Asian group: 25 to 35 percent for women and 13 to 24 percent for men at 40 to 59. The national survey reports Mexican-American, non-Hispanic white and non-Hispanic Black adults as separate groups.
In a village where 48.7 percent of residents are Hispanic or Latino, according to Census Bureau QuickFacts, that's one more reason to treat any chart as a reference point.
Is 30% body fat chubby?
For a woman in her 40s or 50s, 30 percent body fat sits inside the healthy reference band; for a man the same age, it sits above it. The women's band at 40 to 59 runs from 23 to 34 percent, while the men's tops out at 22.
The American Council on Exercise uses broader categories that aren't age-adjusted. It describes 25 to 31 percent for women and 18 to 24 percent for men as typical for the average nonathlete. On its chart, 30 percent is average for a woman and lands in the highest category for a man, which starts at 25.
The national survey adds context. A woman at 30 percent would sit below the 10th percentile for women aged 40 to 59 (31.8 percent), and a man at 30 percent would sit between the median (28.5) and the 75th percentile (32.2).
"Chubby" describes a look, and a scan doesn't measure looks. When a coach reads a result with you, the first thing to look at is direction across 30-day checks. If it's heading away from your goal, a coach looks at training and daily habits together, which is where ongoing nutritional and lifestyle coaching comes in: practical habits built around the foods your family already cooks, not meal plans or fad diets.
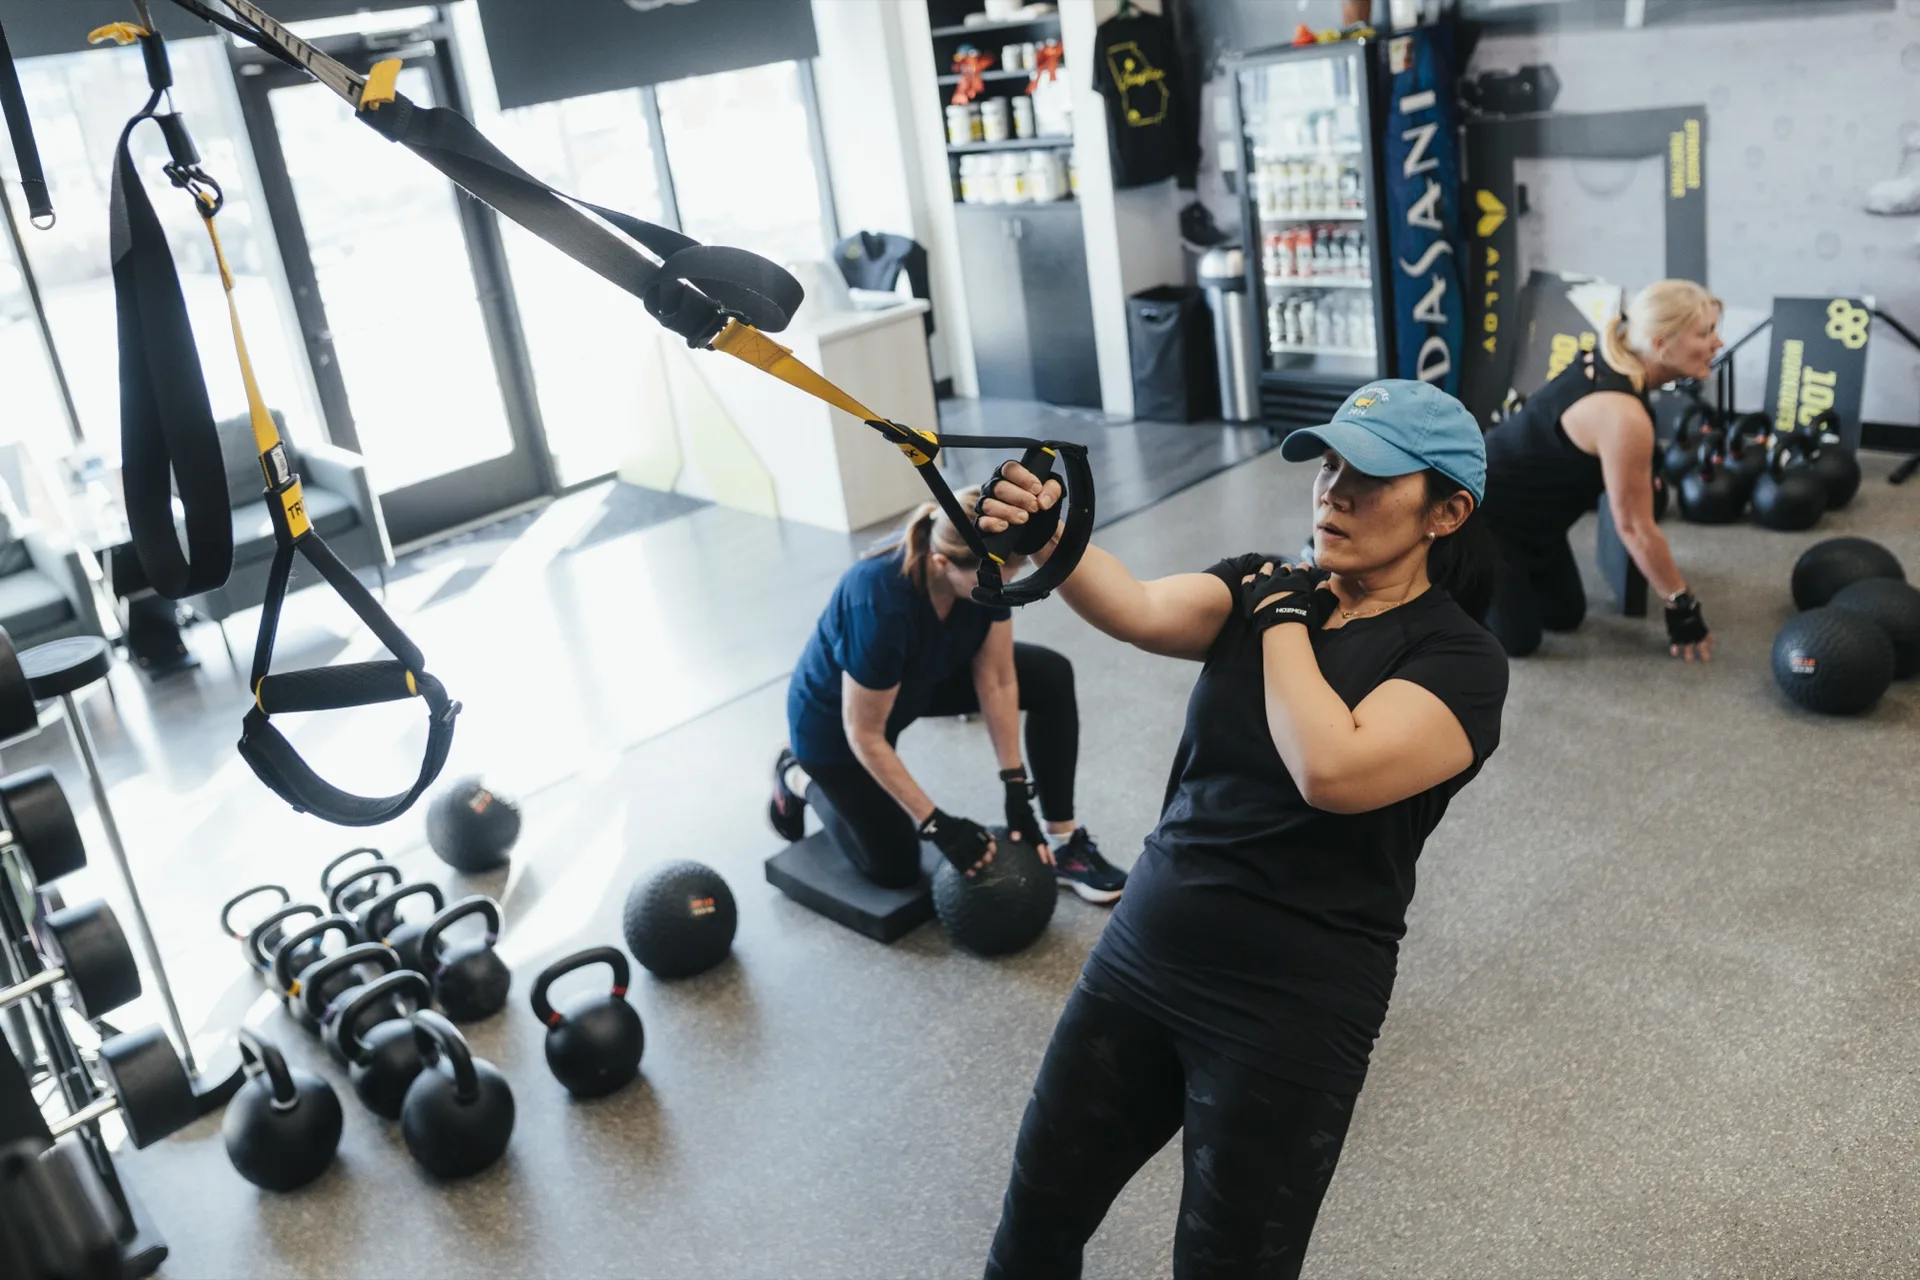
What is a good skeletal muscle mass?
On an InBody body composition scan, the benchmark for a good skeletal muscle mass is the device's normal range: 90 to 110 percent of the standard for your height. InBody's manual centers that skeletal muscle mass normal range on 100 percent, which means you've reached the average muscle weight for someone your height.
For a sense of scale, the MRI study above measured skeletal muscle at an average of 33.0 kilograms in men and 21.0 in women, about 38 percent of body mass for men and 31 percent for women. After 40, it's the number we watch as closely as body fat percentage. It's also the part of the scan that strength training built for adults over 40 is designed to work on.
This is also where BMI falls short, since it's built from height and weight alone. In a 2008 analysis of 13,601 US adults, BMI put 21 percent of men and 31 percent of women in its highest category. Body fat cut-offs placed 50 percent of men and 62 percent of women in the equivalent category. Among people with a BMI of 25 to 29.9, BMI explained only 5 percent of the variation in men's body fat and 18 percent in women's.
How accurate are body fat scans?
Body fat scans on InBody devices are highly repeatable but read a few points lower than DXA on average, so they work best for tracking your own change on one device.
In a 2020 study of 67 adults scanned on two days 24 to 72 hours apart, three InBody models were highly repeatable, with reliability scores of 0.98 or higher. A change smaller than about 2 to 3 percentage points (2.12 to 2.73) fell within measurement noise, and every model read body fat lower than DXA. In a 2022 study of 795 active-duty Marines, an InBody 770 read 3.4 points lower than DXA on average, with individual readings spread about 6 points either side of that.
In practice, don't compare an InBody number with a DXA result from somewhere else, and don't read much into a one-point monthly move.
Hydration is the other variable. European clinical guidelines published in 2004 note that impedance devices like these assume normal hydration, and InBody's testing guidelines spell out the effect: overhydrating overestimates muscle mass, and dehydration underestimates it.
That matters in Miami-Dade, where the National Weather Service office in Miami describes the May 15 to October 15 wet season as bringing almost daily surface dew points in the 70s. A scan after a sweaty morning on the Old Cutler Trail may not match one taken on an ordinary, well-hydrated day.
A simple scan-day routine, drawn from InBody's guidance:
- Scan at the same time of day each month.
- Keep your normal fluid intake the day before, without overdoing it.
- Skip food and exercise for at least 3 hours beforehand; the 770 manual suggests 6 to 12 hours without exercise.
- Avoid alcohol and caffeine for 24 hours, and skip a shower or sauna right before.
- Use the bathroom, remove metal, and stand for at least 5 minutes before stepping on.
If you're pregnant or have a pacemaker or other implant, InBody advises checking with your physician before testing. Any health question a result raises belongs with your physician too, and we're glad to coordinate with them.
We repeat the scan every 30 days in an accountability session, on the same device, so the trend reflects you more than the conditions. The first scan is usually one part of a broader fitness assessment that also looks at movement and baseline fitness.
See your own two numbers
Your free Personal Fitness Assessment includes a first InBody scan covering body fat percentage, skeletal muscle mass, fluid balance and a segment-by-segment breakdown. A coach also looks at how you move, talks through your health history and goals, maybe staying strong for weekend tennis at Dante Fascell Park, measures your fitness baseline and maps out a personalized roadmap, with no pressure to sign up. You leave knowing where both numbers sit today and how they'll be tracked from here. Book your free Personal Fitness Assessment.
Opening October 2026 at 8285 SW 124th Street. Our first 75 founding members get first pick of session times, priority onboarding, and our Founder's Rate. See founding membership.
This article is general fitness information, not medical advice. Talk with your physician before starting a new exercise program, especially if you have a diagnosis, a recent injury or surgery, or activity restrictions.